8 minutes
Banzaicloud Kafka Operator and Broker AutoScaling
The new Kafka Operator from BanzaiCloud includes a neat feature : a Prometheus AlertManager that can receive alerts from your global Prometheus cluster.
In this poste we’re going to see how to use your own Prometheus cluster deployed using the Prometheus Operator.
EDIT also check my previous article on the Banzaicloud Kafka Operator
EDIT : CC only trigger rebalance in an UPscale/DOWNscale operation. It’s the operator that create the new brokers. Article is more precise about this.
Prometheus Operator
This operator is a simple way to bootstrap your Prometheus cluster. Install the Operator, create few manifest and BAM, all set up !
I’m not going to explain it all here, just follow the operator setup. But here’s a Prometheus overview of what is going on there (some parts have been dismissed for clarity) :
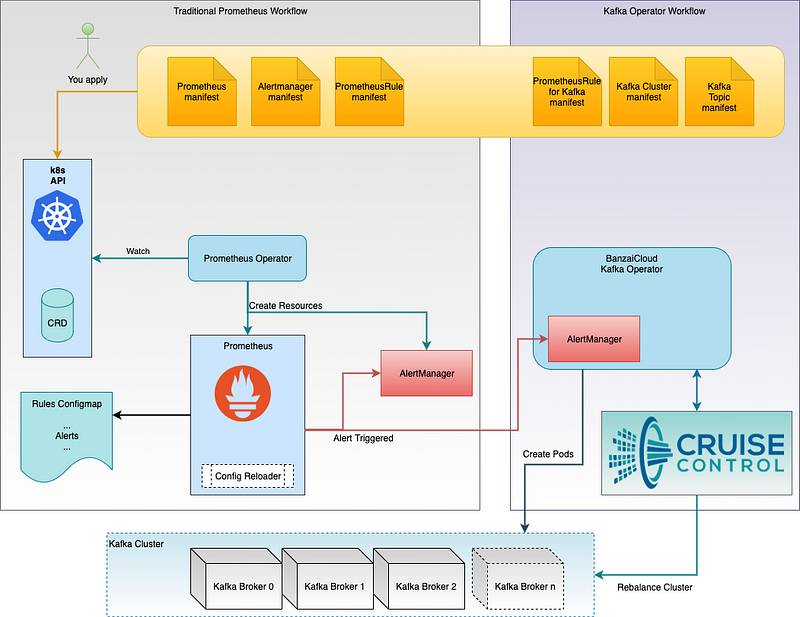
Normally you already have the left side of the picture in place. The Prometheus CR creates a Prometheus cluster. The AlertManager CR creates… an AlertManager pool of servers. The PrometheusRule CR configure Prometheus Cluster to scrape metrics and create alerts.
PrometheusRule
  - name: k8s.rules
    rules:
    - expr: |
        sum(rate(container_cpu_usage_seconds_total{job="kubelet", image!="", container_name!=""}[5m])) by (namespace)
      record: namespace:container_cpu_usage_seconds_total:sum_rate
    - expr: |
        sum(container_memory_usage_bytes{job="kubelet", image!="", container_name!=""}) by (namespace)
      record: namespace:container_memory_usage_bytes:sum
      ...
      - name: alertmanager.rules
    rules:
    - alert: AlertmanagerConfigInconsistent
      annotations:
        message: The configuration of the instances of the Alertmanager cluster `{{$labels.service}}`
          are out of sync.
      expr: |
        count_values("config_hash", alertmanager_config_hash{job="alertmanager-k8s",namespace="monitoring"}) BY (service) / ON(service) GROUP_LEFT() label_replace(max(prometheus_operator_spec_replicas{job="prometheus-operator",namespace="monitoring",controller="alertmanager"}) by (name, job, namespace, controller), "service", "alertmanager-$1", "name", "(.*)") != 1
      for: 5m
      labels:
        severity: critical
...
You see two types of rules :
record ruleswhich evaluate the metrics and record (mutate/store) themalert ruleswhich evaluate an expression and return a boolean value (true/false), which trigger the alert.
Alert rules usually have two other parameters :
forwhich is a duration. If thealertstays triggered for this duration, it is considered valid and is fired.labels(andannotations) are some key:value added to the alert and used byAlertManager. It’s a way to add more context or information to the Alert.
Prometheus to AlertManager
When using the Operator, you have to tell the Prometheus cluster which AlertManager to use.
This is done in the Prometheus Manifest. My Prometheus cluster is name k8s. Here is my full spec as a reference. Create your own using the Jsonnet bundle :
apiVersion: monitoring.coreos.com/v1
enableAdminAPI: "true"
kind: Prometheus
metadata:
  labels:
    prometheus: k8s
  name: k8s
  namespace: monitoring
name: k8s
spec:
  alerting:
    alertmanagers:
    - name: alertmanager-k8s
      namespace: monitoring
      port: web
  baseImage: privaterepo:4567/infra/docker-images/prometheus
  externalUrl: [https://prometheus.devops.k8s.local](https://prometheus.devops.k8s.coyote.local)
  nodeSelector:
    beta.kubernetes.io/os: linux
  replicas: 2
  resources:
    requests:
      memory: 400Mi
  retention: 45d
  ruleSelector:
    matchLabels:
      prometheus: k8s
      role: alert-rules
  securityContext:
    fsGroup: 2000
    runAsNonRoot: true
    runAsUser: 1000
  serviceAccountName: prometheus-k8s
  serviceMonitorNamespaceSelector: {}
  serviceMonitorSelector: {}
  storage:
    volumeClaimTemplate:
      apiVersion: v1
      kind: PersistentVolumeClaim
      spec:
        accessModes:
        - ReadWriteOnce
        resources:
          requests:
            storage: 200Gi
        storageClassName: ssd
  version: v2.11.2
The link is made at the beginning of the Spec :
spec:
  alerting:
    alertmanagers:
    - name: alertmanager-k8s
      namespace: monitoring
      port: web
This tells Prometheus to send alerts to the Service alertmanager-k8s in the namespace monitoring on the port named web.
We can check that using kubectl :
kubectl -n monitoring describe svc alertmanager-k8s

Name:              alertmanager-k8s                    <---
Namespace:         monitoring                          <---
Labels:            alertmanager=k8s
Selector:          alertmanager=k8s,app=alertmanager
Type:              ClusterIP
IP:                10.230.55.190
Port:              web  9093/TCP                       <---
TargetPort:        web/TCP
Endpoints:         10.230.128.129:9093,10.230.128.233:9093,10.230.130.205:9093
Session Affinity:  ClientIP
Events:            <none>
Sending Alerts to Kafka Operator
So, it’s now clear that we have to add an alerting block inside the Prometheus spec.
Let’s first check the Services created by the Kafka Operator (my kafka operator is deployed in the tools namespace) :
kubectl -n tools get svc -l app.kubernetes.io/name=kafka-operator

NAME                 TYPE        CLUSTER-IP     EXTERNAL-IP   PORT(S)            AGE
kafka-alertmanager   ClusterIP   10.230.6.131   <none>        9001/TCP           3d2h
kafka-operator       ClusterIP   10.230.97.22   <none>        443/TCP,8080/TCP   42d
So we have a kafka-alertmanager service…
kubectl -n tools describe svc kafka-alertmanager

Name:              kafka-alertmanager                     <---
Namespace:         tools                                  <---
...
Type:              ClusterIP
IP:                10.230.6.131
Port:              alerts  9001/TCP                       <---
TargetPort:        9001/TCP
Endpoints:         10.230.128.144:9001
Session Affinity:  None
Events:            <none>
So let’s add it with kubectl edit prometheus k8s :
...
name: k8s
spec:
  alerting:
    alertmanagers:
    - name: alertmanager-k8s
      namespace: monitoring
      port: web
    - name: kafka-alertmanager             <---
      namespace: tools                          add these 3 lines
      port: alerts                         <---
...
After few seconds, or minutes, the Prometheus config is reloaded. You can check it’s working by going to your Prometheus web interface and call the /config URL (http://localhost:9090/config if you’re using a port-forward) :
global:
  scrape_interval: 30s
  scrape_timeout: 10s
  evaluation_interval: 30s
  external_labels:
    prometheus: monitoring/k8s
    prometheus_replica: prometheus-k8s-1
alerting:
  alertmanagers:
  - kubernetes_sd_configs:
    - role: endpoints                          <---------- default
      namespaces:                                            ...
        names:
        - monitoring
    scheme: http
    path_prefix: /
    timeout: 10s
    api_version: v1
    relabel_configs:
    - source_labels: [__meta_kubernetes_service_name]
      separator: ;
      regex: alertmanager-k8s
      replacement: $1
      action: keep
    - source_labels: [__meta_kubernetes_endpoint_port_name]
      separator: ;
      regex: web
      replacement: $1
      action: keep
  - kubernetes_sd_configs:                      <---------- Kafka
    - role: endpoints                                        ...
      namespaces:
        names:
        - tools
    scheme: http
    path_prefix: /
    timeout: 10s
    api_version: v1
    relabel_configs:
    - source_labels: [__meta_kubernetes_service_name]
      separator: ;
      regex: kafka-alertmanager
      replacement: $1
      action: keep
    - source_labels: [__meta_kubernetes_endpoint_port_name]
      separator: ;
      regex: alerts
      replacement: $1
      action: keep
Alerting Rules
Now we have Prometheus sending alerts to the Kafka Operator, we need to create specific rules for Kafka….
You can find a default example on the Github project.
apiVersion: monitoring.coreos.com/v1
kind: PrometheusRule
metadata:
creationTimestamp: null
labels:
prometheus: k8s
role: alert-rules
name: kafka-alerts
spec:
groups:
- name: KafkaAlerts
rules:
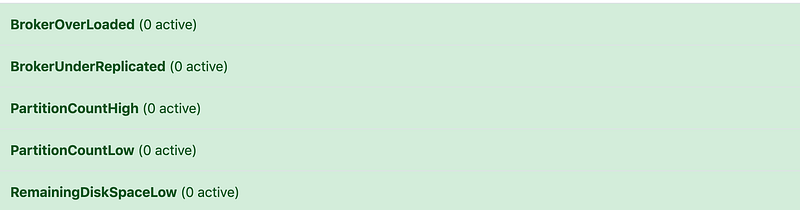
- alert: BrokerOverLoaded
expr: avg(sum by(brokerId, kafka_cr, namespace) (rate(kafka_network_requestmetrics_requests_total[15m]))) > 500
for: 5m
labels:
severity: alert
annotations:
description: 'broker {{ $labels.brokerId }} overloaded (current value is: {{ $value }})'
summary: 'broker overloaded'
brokerConfigGroup: 'default_group'
command: 'upScale'
Let’s break this down :
- metadata.labels
You need at least the two that are here. the
prometheusvalue should be the name of your Prometheus server as described in theprometheusresource. I’m not sure for therole… just keep it :) - spec.rules.annotations These are “config values” that you are going to pass to the Kafka Operator AlertManager. You need them to tell the Operator HOW to create the new brokers.
From the example above, if the alert is triggered, it will send this information to the Operator :
broker 0 is overloaded (current value is 12): you will see that in the Operator logs if set to Info log-levelcommand: upScale: this will be treated by the Operator as a direct command to upscale.
The Operator will create a new Broker (pod) which will join the cluster.
It will forward the command to CruiseControl, which will trigger a Rebalance, so the topics/partitions/leaders are spread to the new broker.
Other commands includes “downScale” and “addPVC”. I haven’t test the PVC one yet…brokerConfigGroup: 'default-group': this is some configuration from thekafkaclustercustom resource definition.
In fact you can use most of the config parameter of a BrokerConfig.
(have you read my article on installing Kafka Operator ?)
From the example I gave earlier, here’s what we can add to the alert to configure the new broker :
# If brokerConfigGroup is defined it will override scaled broker config
# brokerConfigGroup: 'default_group'
storageClass: 'standard'
mountPath: '/kafkalog'
diskSize: '2G'
image: 'wurstmeister/kafka:2.12-2.1.0'
As a wrap up, here’s my full PrometheusRule for Kafka Operator. Note that the values are testing values… you may (you will) have to tune them :
apiVersion: monitoring.coreos.com/v1
kind: PrometheusRule
metadata:
  creationTimestamp: null
  labels:
    prometheus: k8s
    role: alert-rules
  name: kafka-alerts
spec:
  groups:
  - name: KafkaAlerts
    rules:
    - alert: BrokerOverLoaded
      expr: avg(sum by(brokerId, kafka_cr, namespace) (rate(kafka_network_requestmetrics_requests_total[15m]))) > 500
      for: 5m
      labels:
        severity: alert
      annotations:
        description: 'broker {{ $labels.brokerId }} overloaded (current value is: {{ $value }})'
        summary: 'broker overloaded'
        brokerConfigGroup: 'default_group'
        command: 'upScale'
    - alert: BrokerUnderReplicated
      expr: kafka_server_replicamanager_underreplicatedpartitions > 0
      for: 5m
      labels:
        severity: alert
      annotations:
        description: 'broker {{ $labels.brokerId }} underreplicated'
        summary: 'broker underreplicated'
        brokerConfigGroup: 'default_group'
        command: 'upScale'
    - alert: PartitionCountHigh
      expr: max(kafka_server_replicamanager_partitioncount)  by (namespace, kafka_cr) > 800
      for: 3m
      labels:
        severity: alert
      annotations:
        description: 'broker {{ $labels.brokerId }} has high partition count'
        summary: 'high partition count'
        brokerConfigGroup: 'default_group'
        command: 'upScale'
    - alert: PartitionCountLow
      expr: min(kafka_server_replicamanager_partitioncount)  by (namespace, kafka_cr) < 50
      for: 3m
      labels:
        severity: alert
      annotations:
        description: 'broker {{ $labels.brokerId }} has low partition count'
        summary: 'low partition count'
        brokerConfigGroup: 'default_group'
        command: 'downScale'
    - alert: RemainingDiskSpaceLow
      expr: kubelet_volume_stats_available_bytes{persistentvolumeclaim=~"kafka-.*"} < 1 * 1000 * 1000 * 1000
      for: 2m
      labels:
        severity: alert
      annotations:
        description: 'broker {{ $labels.brokerId }} has low disk space'
        summary: 'low diskspace'
        brokerConfigGroup: 'default_group'
        command: 'addPVC'
Conclusion
We now know how to use the Prometheus Metrics from Kafka to up/downscale our cluster.
Note that this feature can rapidly become a chaos factor : during my tests, a manual “rebalance” of the partitions/leaders triggered a downscale of the cluster, which went from 3 nodes to 2. The cluster was then in a “failed” state as I require a minimum of 3 brokers alive.
This situation then triggered two upScale alerts, which grow the cluster from 2 to 4 nodes…
I was live testing so I was able to change the thresholds. The scale situation stopped, but imagine this happen during the night when you’re oncall ?
Because that’s where this situation is going to happen right ?
Happy Kafka/Prometheus config !
Thanks again to the Banzaicloud team for doing all this opensource !
Note : We discussed the need to block the downscale of a cluster below the count of the minimum cluster size on Slack. There should be a way to set that at some point…
Note 2 : at the moment (Kafka Operator 0.6.1), you will get logs for every alert that is fired by Prometheus… Watch out as you’ll end up with quite some logs… next release should silently drop all alerts not linked to the Kafka cluster.