13 minutes
Understanding Istio and TCP services

overview
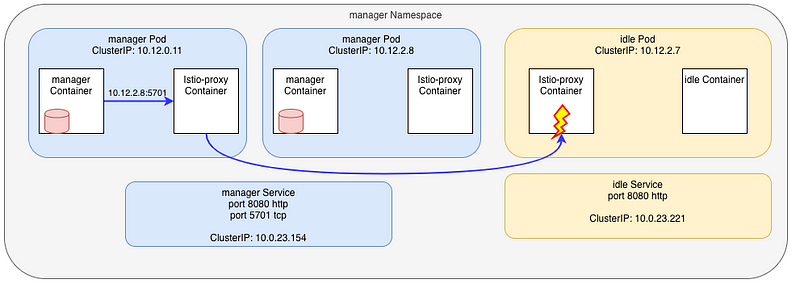
I lately came across an Istio setup where both the downstream (client) and the upstream (server) were using the same sets of ports:
- port 8080 for HTTP protocol
- port 5701 for Hazelcast protocol, a Java based memory database embedded in the pod’s workload, using TCP
The setup is presented here:
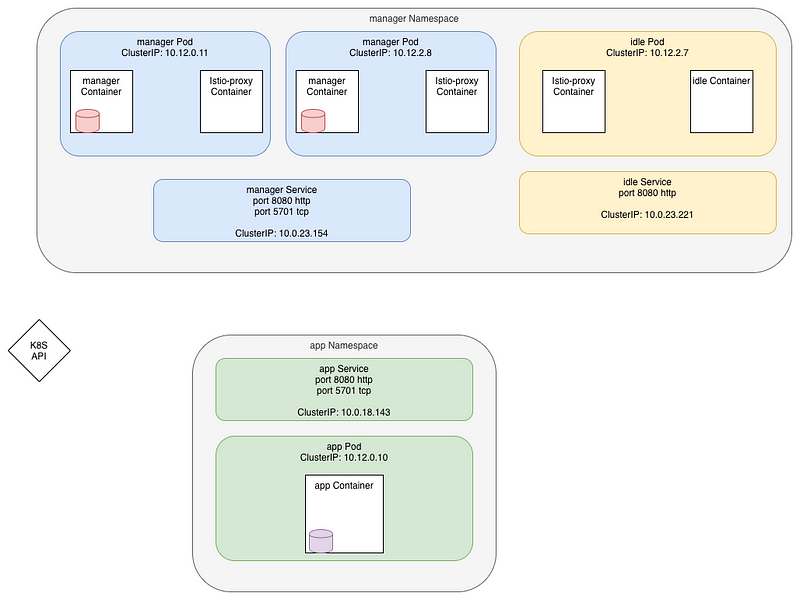
In theory, two types of communications happens:
- each Hazelcast database (the red and purple cylinders) talk to each other on port 5701 using TCP protocol.
Cluster is discovered using the Hazelcast Kubernetes plugin which calls the API to get the Pod IPs.
Then connections are made at TCP level using the IP:port of the pod - the
managercalls theappon the http port 8080
We’re going to focus on the first connexion for now, specifically the one happening between the manager pods as they are going through the Istio Proxy.
Let’s first leverage the istioctl CLI to get the configuration of the listeners on one of the pods:
istioctl pc listeners manager-c844dbb5f-ng5d5.manager --port 5701

ADDRESS         PORT     TYPE
10.12.0.11      5701     TCP
10.0.23.154     5701     TCP
10.0.18.143     5701     TCP
We have 3 entries for port 5701. They are all of typeTCP which is what we defined.
We clearly see we have one entry for our local IP (10.12.0.11) and one for each service which is using the 5701 port, the manager (10.0.23.154) and the app (10.0.18.143) services.
Inbound connections
The first one, for address 10.12.0.11 is an INBOUNDlistener that is used when connections enters into the Pod. As we are on a TCP service, it does not have a route, but directly point to a cluster:
inbound|5701|tcp-hazelcast|manager.manager.svc.cluster.local
If we check all clusters on port 5701 we have:
istioctl pc clusters manager-7948dffbdd-p44xx.manager --port 5701

SERVICE FQDN                          PORT     SUBSET            DIRECTION     TYPE
app.app.svc.cluster.local             5701     -                 outbound      EDS
manager.manager.svc.cluster.local     5701     -                 outbound      EDS
manager.manager.svc.cluster.local     5701     tcp-hazelcast     inbound       STATIC
The last one is our INBOUND , let’s check it:
istioctl pc clusters manager-7948dffbdd-p44xx.manager --port 5701 --direction inbound -o json
[
    {
        "name": "inbound|5701|tcp-hazelcast|manager.manager.svc.cluster.local",
        "type": "STATIC",
        "connectTimeout": "1s",
        "loadAssignment": {
            "clusterName": "inbound|5701|tcp-hazelcast|manager.manager.svc.cluster.local",
            "endpoints": [
                {
                    "lbEndpoints": [
                        {
                            "endpoint": {
                                "address": {
                                    "socketAddress": {
                                        "address": "127.0.0.1",
                                        "portValue": 5701
                                    }
                                }
                            }
                        }
                    ]
                }
            ]
        },
        "circuitBreakers": {
            "thresholds": [
                {
                    "maxConnections": 4294967295,
                    "maxPendingRequests": 4294967295,
                    "maxRequests": 4294967295,
                    "maxRetries": 4294967295
                }
            ]
        }
    }
]
This can’t be simpler… check the lbEndpoints definition: just forward the connection to the localhost (127.0.0.1) port 5701, our app.
Outbound connections
Outbound connections are originating from inside the pod to reach external resources.
From what we saw above, we have two known endpoints that defined the port 5701: manager.manger service and app.app service.
Let’s check the content of the manager:
istioctl pc listeners manager-7948dffbdd-p44xx.manager --port 5701 --address 10.0.23.154 -o json
[
    {
        "name": "10.0.23.154_5701",
        "address": {
            "socketAddress": {
                "address": "10.0.23.154",
                "portValue": 5701
            }
        },
        "filterChains": [
            {
                "filters": [
                    {
                        "name": "envoy.tcp_proxy",
                        "typedConfig": {
                            "[@type](http://twitter.com/type)": "type.googleapis.com/envoy.config.filter.network.tcp_proxy.v2.TcpProxy",
                            "statPrefix": "outbound|5701||manager.manager.svc.cluster.local",
                            "cluster": "outbound|5701||manager.manager.svc.cluster.local",
                            "accessLog": [
...
                            ]
                        }
                    }
                ]
            }
        ],
        "deprecatedV1": {
            "bindToPort": false
        },
        "trafficDirection": "OUTBOUND"
    }
]
I removed some of the values here so we better understand. It’s not that complicated.
First, we match on the destination IP and port
"address": {
            "socketAddress": {
                "address": "10.0.23.154",
                "portValue": 5701
            }
        },
Then we have a filterChain and an envoy.tcp.proxy filter.
Here again, the proxy points us to cluster named outbound|5701||manager.manager.svc.cluster.local .
Envoy is not using any route as we are using a TCP protocol and we have nothing to base the routing on anyways.
Let’s see inside the cluster:
istioctl pc clusters manager-7948dffbdd-p44xx.manager --port 5701 --fqdn manager.manager.svc.cluster.local --direction outbound -o json
[
    {
        "transportSocketMatches": [
            {
                "name": "tlsMode-istio",
                "match": {
                    "tlsMode": "istio"
                },
...
                }
            },
            {
                "name": "tlsMode-disabled",
                "match": {},
                "transportSocket": {
                    "name": "envoy.transport_sockets.raw_buffer"
                }
            }
        ],
        "name": "outbound|5701||manager.manager.svc.cluster.local",
        "type": "EDS",
        "edsClusterConfig": {
            "edsConfig": {
                "ads": {}
            },
            "serviceName": "outbound|5701||manager.manager.svc.cluster.local"
        },
        "connectTimeout": "1s",
        "circuitBreakers": {
...
        },
        "filters": [
...
        ]
    }
]
I also removed some parts here to focus on the important stuff:
- first two blocks: Envoy will check if it can do SSL (TLS) and set the certificate if we can. Else, use plain TCP.
- find the destination’s pod using the
EDSprotocol. This stands forEndpointDiscoveryService. Envoy will look up its list of endpoints for the service namedoutbound|5701||manager.manager.svc.cluster.localThese endpoints are selected based on the Kubernetes service endpoint list (kubectl get endpoints -n manager manager).
We can also check the list of endpoints configured in Istio:
istioctl pc endpoints manager-7948dffbdd-p44xx.manager --cluster "outbound|5701||manager.manager.svc.cluster.local"

ENDPOINT            STATUS      OUTLIER CHECK     CLUSTER
10.12.0.12:5701     HEALTHY     OK                outbound|5701||manager.manager.svc.cluster.local
10.12.1.6:5701      HEALTHY     OK                outbound|5701||manager.manager.svc.cluster.local
All this sounds pretty good.
Testing the setup
To demonstrate the whole thing, let’s connect to one of the manager’s pod and call the service on port 5701:
k -n manager exec -ti manager-7948dffbdd-p44xx -c manager sh
telnet manager.manager 5701
You should get the following answer after pushing the enter key some times:
Connected to manager.manager
Connection closed by foreign host
The server we are using is in fact an HTTPS web server, expecting a TLS handshake… but whatever, we just want to connect to a TCP port here. So, the connection is working fine.
Repeat this command multiple times.
Let’s look at the logs from the Istio-Proxy sidecars, using the K8s log tailer Stern:
stern -n manager manager -c istio-proxy

manager-7948dffbdd-p44xx istio-proxy [2020-07-23T14:26:27.081Z] "- - -" 0 - "-" "-" 6 0 506 - "-" "-" "-" "-" "10.12.0.12:5701" outbound|5701||manager.manager.svc.cluster.local 10.12.0.12:51100 10.0.23.154:5701 10.12.0.12:47316 - -
manager-7948dffbdd-p44xx istio-proxy [2020-07-23T14:26:27.081Z] "- - -" 0 - "-" "-" 6 0 506 - "-" "-" "-" "-" "127.0.0.1:5701" inbound|5701|tcp-hazelcast|manager.manager.svc.cluster.local 127.0.0.1:59430 10.12.0.12:5701 10.12.0.12:51100 outbound_.5701_._.manager.manager.svc.cluster.local -
manager-7948dffbdd-p44xx istio-proxy [2020-07-23T14:26:08.632Z] "- - -" 0 - "-" "-" 6 0 521 - "-" "-" "-" "-" "10.12.1.6:5701" outbound|5701||manager.manager.svc.cluster.local 10.12.0.12:49150 10.0.23.154:5701 10.12.0.12:47258 - -
manager-7948dffbdd-sh7rx istio-proxy [2020-07-23T14:26:08.634Z] "- - -" 0 - "-" "-" 6 0 519 - "-" "-" "-" "-" "127.0.0.1:5701" inbound|5701|tcp-hazelcast|manager.manager.svc.cluster.local 127.0.0.1:57844 10.12.1.6:5701 10.12.0.12:49150 outbound_.5701_._.manager.manager.svc.cluster.local -
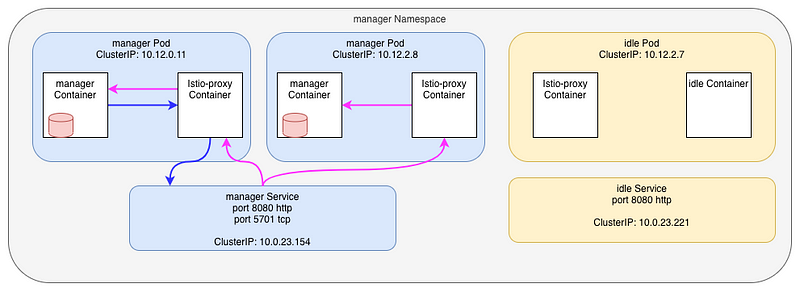
I grouped the requests by two, and I have two different pairs:
- an
outboundconnection tomanager.manager.svc - an inbound connection to ourselves
- an
outboundconnection tomanager.manager.svc - an inbound connection on the second manager’s Pod (
10.12.2.8:5701)
Of course, Istio is using the round-robin load-balancing algo by default, so it totally explain what is going on here. Each consecutive request go to a different pod.
Here, blue link is outbound while pink is inbound
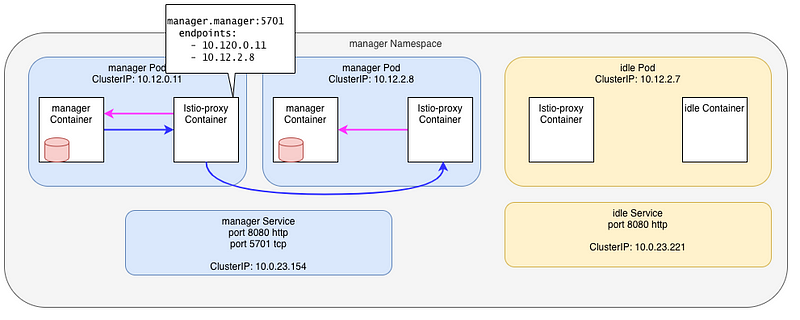
OK, this is not really what’s going on ! I tricked you !!
Istio (Envoy) does NOT send traffic to the Kubernetes Service. Services are used by Pilot (Istiod) to build the mesh topology, then the informations is sent to each Istio-proxy, which then send traffic to the Pods. It finally look more like that:
But that’s not how Hazelcast server works either !
Hazelcast cluster communication
The truth is, Hazelcast does no use the service name for its communications.
In fact, the Hazelcast Kubernetes plugin leverage the Kubernetes API (or a Headless service) to learn about all the pods play in the Hazelcast cluster. It’s unclear to me if it’s then using the Pod’s FQDN or it’s IP. In fact it does not matter to us.
As with every application using a “smart” client, like Kafka, each instance needs to talk directly to each of the other instances that are part of the cluster.
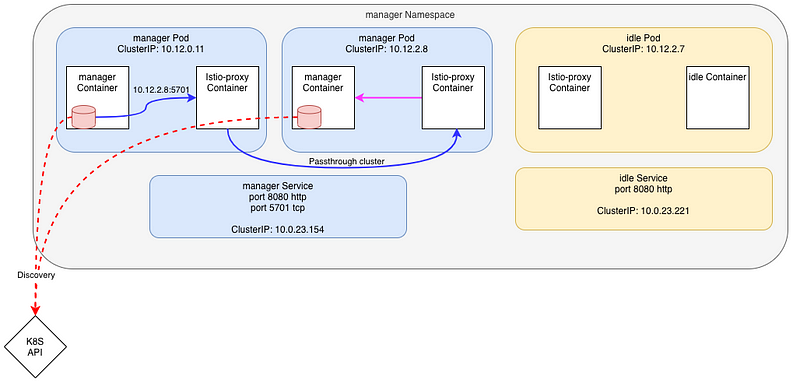
So, what’s happening if we try to call the second manager’s Pod using it’s IP ?
Client pod:
manager-7948dffbdd-p44xx istio-proxy [2020-07-23T14:39:12.587Z] "- - -" 0 - "-" "-" 6 0 2108 - "-" "-" "-" "-" "10.12.2.8:5701" PassthroughCluster 10.12.0.11:51428 10.12.2.8:5701 10.12.0.11:51426 - -
Server pod:
manager-7948dffbdd-sh7rx istio-proxy [2020-07-23T14:39:13.590Z] "- - -" 0 - "-" "-" 6 0 1113 - "-" "-" "-" "-" "127.0.0.1:5701" inbound|5701|tcp-hazelcast|manager.manager.svc.cluster.local 127.0.0.1:59986 10.12.2.8:5701 10.12.0.11:51428 - -
- the outbound connection is using the Passthrough cluster as the destination IP (
10.12.2.8) is not known inside the mesh - the upstream connection uses the
inboundcluster as before
Here’s a schema of this situation. In red, the Hazelcast DB nodes (the red cylinder) calls the API (the red-dot arrow) to get all the pods that are part of the cluster. Once done, the first pod calls the IP of the next pod (blue line).
This is not perfect, but at least, it’s working
Things can go bad
Later on I was called as something strange was going on in the cluster.
At some point, when the manager application tried to connect to the Hazelcast port, the connection was routed to the idle pod in the manager namespace.
How possible ? This pod even don’t expose the port 5701 !
Here’s an overview:
Nothing changed in the manager Namespace, but looking at the services inside the app namespace, I saw an ExternalName service was later added:
k get svc  -n app

NAME      TYPE           CLUSTER-IP    EXTERNAL-IP                      PORT(S)             AGE
app       ClusterIP      10.0.18.143   <none>                           8080/TCP,5701/TCP   18h
app-ext   ExternalName   <none>        idle.manager.svc.cluster.local   8080/TCP,5701/TCP   117s
An ExternalName service type is one that, instead of defining an internal load-balancer that holds the list of the active target pods, is only a CNAME to another service.
Here’s its definition:
apiVersion: v1
kind: Service
metadata:
  labels:
    app.dmp/name: app
  name: app-ext
  namespace: app
spec:
  ports:
  - name: http-app
    port: 8080
    protocol: TCP
    targetPort: 8080
  - name: tcp-hazelcast
    port: 5701
    protocol: TCP
    targetPort: 5701
  externalName: idle.manager.svc.cluster.local
  sessionAffinity: None
  type: ExternalName
This specific definition makes the name app-ext.app.svc.cluster.local resolve to idle.manager.svc.cluster.local (well, CNAME, then resolve to the IP of the service, 10.0.23.221)
Let’s look again at our Listeners on the manager pod:
istioctl pc listeners manager-7948dffbdd-p44xx.manager --port 5701

ADDRESS         PORT     TYPE
10.12.0.12      5701     TCP
10.0.18.143     5701     TCP
10.0.23.154     5701     TCP
0.0.0.0         5701     TCP
we now have a new 0.0.0.0 entry !
Let’s look at the config:
istioctl pc listeners manager-7948dffbdd-p44xx.manager --port 5701 --address 0.0.0.0 -o json

[
    {
        "name": "0.0.0.0_5701",
        "address": {
            "socketAddress": {
                "address": "0.0.0.0",
                "portValue": 5701
            }
        },
        "filterChains": [
            {
                "filterChainMatch": {
                    "prefixRanges": [
                        {
                            "addressPrefix": "10.12.0.11",
                            "prefixLen": 32
                        }
                    ]
                },
                "filters": [
                    {
                        "name": "envoy.filters.network.wasm",
...
                    },
                    {
                        "name": "envoy.tcp_proxy",
                        "typedConfig": {
                            "[@type](http://twitter.com/type)": "type.googleapis.com/envoy.config.filter.network.tcp_proxy.v2.TcpProxy",
                            "statPrefix": "BlackHoleCluster",
                            "cluster": "BlackHoleCluster"
                        }
                    }
                ]
            },
            {
                "filters": [
                    {
                        "name": "envoy.filters.network.wasm",
...
                    },
                    {
                        "name": "envoy.tcp_proxy",
                        "typedConfig": {
                            "[@type](http://twitter.com/type)": "type.googleapis.com/envoy.config.filter.network.tcp_proxy.v2.TcpProxy",
                            "statPrefix": "outbound|5701||app-ext.app.svc.cluster.local",
                            "cluster": "outbound|5701||app-ext.app.svc.cluster.local",
                            "accessLog": [
...
                            ]
                        }
                    }
                ]
            }
        ],
        "deprecatedV1": {
            "bindToPort": false
        },
        "trafficDirection": "OUTBOUND"
    }
]
Suddenly it’s a little more complicated.
- first, we accept any destination IP for port 5701
- then we enter the filterChains_
- if the real destinations is ourselves (the pod IP,
10.12.0.11), drop the request (send it to the B_lackHoleCluster_) - else use cluster
outbound|5701||app-ext.app.svc.cluster.localto find the forwarding address
- if the real destinations is ourselves (the pod IP,
Let’s check this cluster:
istioctl pc clusters manager-7948dffbdd-p44xx.manager  --fqdn app-ext.app.svc.cluster.local --port 5701 -o json

[
    {
        "name": "outbound|5701||app-ext.app.svc.cluster.local",
        "type": "STRICT_DNS",
        "connectTimeout": "1s",
        "loadAssignment": {
            "clusterName": "outbound|5701||app-ext.app.svc.cluster.local",
            "endpoints": [
                {
                    "locality": {},
                    "lbEndpoints": [
                        {
                            "endpoint": {
                                "address": {
                                    "socketAddress": {
                                        "address": "idle.manager.svc.cluster.local",
                                        "portValue": 5701
                                    }
                                }
                            },
Once again, this cluster is pretty simple, it just forward the traffic to the server idle.manager.svc.cluster.local using the DNS to get the real IP.
Let’s do a telnet again to the second manager’s Pod and check the logs:
manager-7948dffbdd-p44xx istio-proxy [2020-07-23T14:47:24.040Z] "- - -" 0 UF,URX "-" "-" 0 0 1000 - "-" "-" "-" "-" "10.0.23.221:5701" outbound|5701||app-ext.app.svc.cluster.local - 10.12.1.6:5701 10.12.0.12:52852 - -
- request is in error:
0 UF,URX
From the Envoy doc, UF is Upstream connection failure and URX is maximum connect attempts (TCP) was reached.
This is perfectly normal as theidleservice does not expose the port 5701 (nor the Pod binds it) - request was forwarded to the
outbound|5701||app-ext.app.svc.cluster.localcluster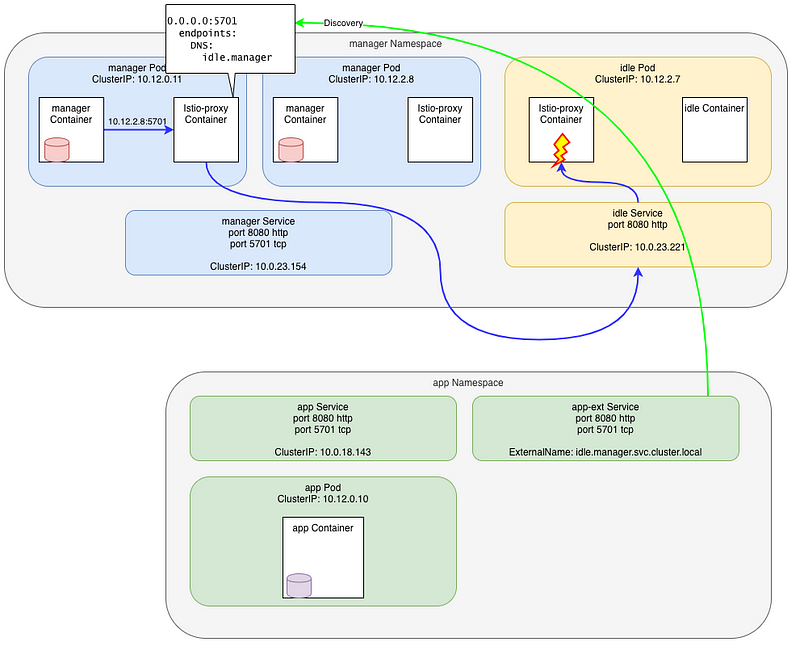
Wait, WHAAAAT ?
A service created in another Namespace just broke our Hazelcast cluster ?
The explanation is easy here… before this service was created, the second Pod’s IP was unknown and Envoy was using the Passthrough cluster. Now, the IP is still unknown but is matched by the catchall 0.0.0.0:5710 listener.
The explanation is easy here… before this service was created, the real Pod’s IP was unknown in the mesh and Envoy was using the Passthrough cluster to send the request directly to it.
Now, the IP is still unknown but is matched by the catchall 0.0.0.0:5710 Listener and forwarded to a known Cluster, outbound|5701||app-ext.app.svc.cluster.local, which is pointing to the idle Service.
Solving the issue
What can we do to recover our Hazelcast cluster ?
no 5701 port
One of the solutions would be to NOT expose the port 5701 in the ExternalName service. Then, no 0.0.0.0:5701 Listener, and traffic will flow through the Passthrough Cluster as before. Not ideal to track our Mesh traffic, but working fine.
no ExternalName
Another solution would be to not use ExternalName at all…
The Externalname was in fact a new service that was added in certain circumstances where we want all the calls going to the app service to be forwarded to the idle.manager service.
Beside the fact that it broke our Hazelcast cluster, it also means that we had to delete the ClusterIP service then re-create it as an ExternalName type. Both of these actions forced Istiod (Pilot) to re-build the complete mesh config and update all the proxies in the mesh, including a change in the Listeners that caused a drain of all opened connexions, twice !
This is one of the worst pattern you can have when using a service mesh.
Instead of playing with Service resource, one possible pattern would be to add a VirtualServicefor the app application that will send traffic to the idle.managerservice only when we need. This would not create or delete any listener and will only update the route:
apiVersion: networking.istio.io/v1beta1
kind: VirtualService
metadata:
  name: app-idle
spec:
  hosts:
  - app.app.svc.cluster.local
  http:
  - name: to-idle
    route:
    - destination:
        host: idle.manager.svc.cluster.local
        port:
          number: 8080
This is saying that all traffic for Service app.app.svc.cluster.local must be send to idle.manager.svc.cluster.local:8080.
When we want the traffic to effectively go to the app application, just update the VirtualService and set the destination to app.app.svc.cluster.local, or simply delete it.
Sidecars
With recent Istio, we can also leverage the use of Sidecar resource to limit what the manager Pod can see inside the mesh.
Specifically in this case, we could use an annotation on the ExternalName service to only make it visible in the app namespace:
apiVersion: v1
kind: Service
metadata:
  labels:
    app/name: app
  annotations:
    networking.istio.io/exportTo: "."
  name: app-ext
  namespace: app
spec:
  ports:
  - name: http-app
    port: 8080
    protocol: TCP
    targetPort: 8080
  - name: tcp-hazelcast
    port: 5701
    protocol: TCP
    targetPort: 5701
  externalName: idle.manager.svc.cluster.local
  sessionAffinity: None
  type: ExternalName
By adding the annotation networking.istio.io/exportTo: “.” the service is not seen by the managers Pods. No more 0.0.0.0:5701:
istioctl pc listeners manager-7948dffbdd-p44xx.manager --port 5701

ADDRESS         PORT     TYPE
10.0.18.143     5701     TCP
10.12.0.12      5701     TCP
10.0.25.229     5701     TCP
different TCP ports
If we’re willing to update our application, there’s a few other solutions we could use as well.
We could use different ports for different TCP services. This is the hardest to put in place when you’re already dealing with complex applications like databases, but it’s been the only option available in Istio for a long time.
We could also update our applications to use TLS and populate the Server Name Indication (SNI). Envoy/Istio can use SNI to route traffic for TCP services on the same port because Istio treats the SNI for routing TLS/TCP traffic just like it treats the Host header for HTTP traffic.
Conclusion
First I want to note that no Hazelcast cluster were damaged during this demo 😄
The problem here is not linked to Hazelcast at all and can happen with any set of services using the same TCP ports.
Istio and Envoy have very limited way to play with TCP or unknown protocols. When the only thing you have to inspect is the IP and the port, there’s not much to do.
Always keep in mind the best practices to configure your clusters:
- try to avoid using the same port number for different TCP services where you can
- always prefix the protocol inside port names (
tcp-hazelcast,http-frontend,grpc-backend) — see protocol selection docs - add
Sidecarresources as early as possible to restrict the sprawl of configuration, and set the defaultexportToto namespace local in your Istio installation - configure your applications to communicate by names (FQDN), not IPs
- always configure FQDN (including
svc.cluster.local) in Istio Resources
Note: This blog post is a re-post of the original article I wrote for Tetrate.io blog.